
Powerful Dashboards with Claude Gradually Replacing PowerBI
There's a pattern I encounter in almost every SMB. The data is there. Revenue figures are in accounting, leads in the CRM, website visits in Google Analytics. But a coherent picture of how the business is performing? That consists of a weekly Excel sheet someone manually maintains, or a PowerBI report an external consultant built three months ago and hasn't touched since.
This isn't a matter of discipline. It's a matter of barrier. The barrier to understanding and visualizing data was simply too high for the average entrepreneur. Until that barrier disappeared.
PowerBI is powerful. And that's precisely the problem.
PowerBI is an impressive tool. It can do almost anything you can imagine in data analysis and visualization. But that capability comes with a price that goes beyond license costs.
You need DAX (PowerBI's formula language) for anything beyond a simple bar chart. You need insight into data models to combine multiple sources. You need Power BI Service to share reports. And you need someone who understands and maintains all of it.
For large organizations with a BI team, that's fine. For the entrepreneur who just wants to know how their revenue is developing, which customers are most profitable, and where leads drop off in their sales process, it's disproportionate.
The result is what I see everywhere: too few dashboards, too late, too static.
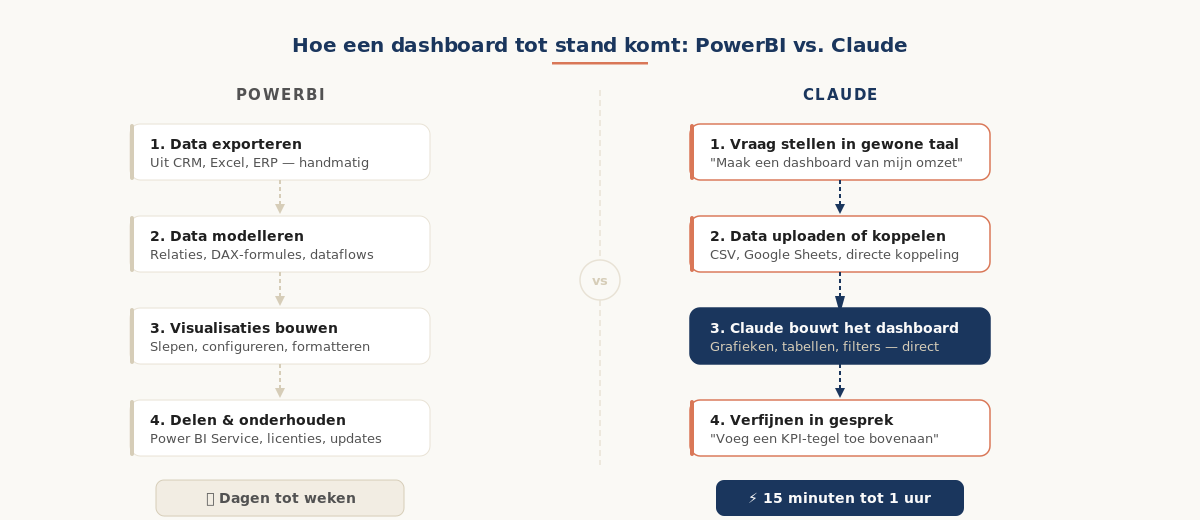
What Claude does differently
Claude builds dashboards based on a conversation. You describe what you want to see, you upload your data or link a source, and Claude generates an interactive visualization. Not as a mockup, not as a description, but as a working dashboard you can use immediately.
That might sound like a simple equation: AI plus data equals dashboard. But the shift is more fundamental than that.
With PowerBI, the process begins with the tool. You open PowerBI, you think about data models, you drag fields onto a canvas. The tool dictates the order of your thinking.
With Claude, the process begins with the question. You think about what you want to know, you ask that question in plain language, and the tool adapts to your reasoning. That's a different relationship between entrepreneur and data, one where the entrepreneur stays in control instead of adapting to the tool.
What it can already do
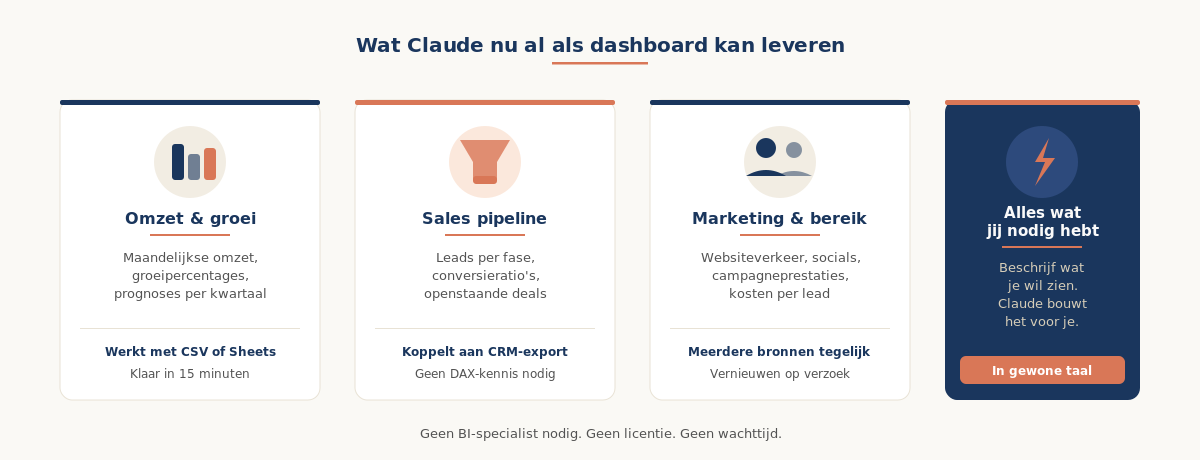
The practical applications I see working for entrepreneurs are not spectacular, but direct valuable.
Revenue dashboards based on a CSV export from accounting. Sales funnels showing where leads drop off, built on an export from the CRM. Marketing overviews combining website traffic, social media performance, and lead costs into one view. Operational KPIs normally spread across three different systems.
None of these dashboards require BI expertise. They require one thing: knowing what you want to know. The rest is a conversation.
And it's faster than you think. What takes a day's work in PowerBI for someone who knows the system, takes half an hour in Claude for someone who doesn't. This pace has consequences for how you think about reporting.
The strategic shift
Here lies the actual movement, and it goes beyond the comparison with PowerBI.
Data insight was for years a privilege of companies that could invest in BI tooling and the expertise to use it. The rest worked with Excel and gut feeling. This is not because those entrepreneurs are less intelligent; it's because the barrier was simply too high.
AI lowers that barrier to almost zero. And that changes who can make decisions based on data.
The entrepreneur who used to receive a quarterly report from an external consultant can now have a current overview themselves every week. The sales manager who tracked their pipeline in Excel can now maintain a live funnel that adapts the moment they ask a question. The marketer who didn't know how to compare campaign output with acquisition costs can now do so without the intervention of a data analyst.
This isn't replacing PowerBI with something handier. This is democratizing access to data-driven decisions.
What this is not
An honest picture also requires boundaries.
Claude dashboards are not a replacement for enterprise BI in complex environments. If you work with datasets of millions of rows, real-time data streams from production systems, or compliance requirements around data governance, then specialized BI tooling remains the right choice.
And a dashboard is never better than the question behind it. The value of AI in data visualization is not in the graph it creates; it's in the clarity with which you, as an entrepreneur, know what you want to understand. A vague question yields a vague graph. That applies to PowerBI as much as it does to Claude.
The entrepreneur who benefits most from this shift is the entrepreneur who clearly knows which questions matter for their business. AI accelerates the answer. The question itself remains human work.
What this means for the next twelve months
Companies that start with AI-driven reporting now are building something beyond faster dashboards. They are building a reflex, the habit of consulting data before making a decision rather than after.
That sounds obvious. But for most SMBs, it's a real change. Not in tooling, but in culture. And that cultural change starts simpler than you think: with one question you ask your data, in plain language, and a dashboard that provides an immediate answer.
The technology is here. The question is whether you use it.
Do you want to know which questions you should ask your data, and how to practically implement that for your company? That's exactly what High Performing Company helps with. Schedule a consultation and we'll look together at where the biggest leverage lies for you.